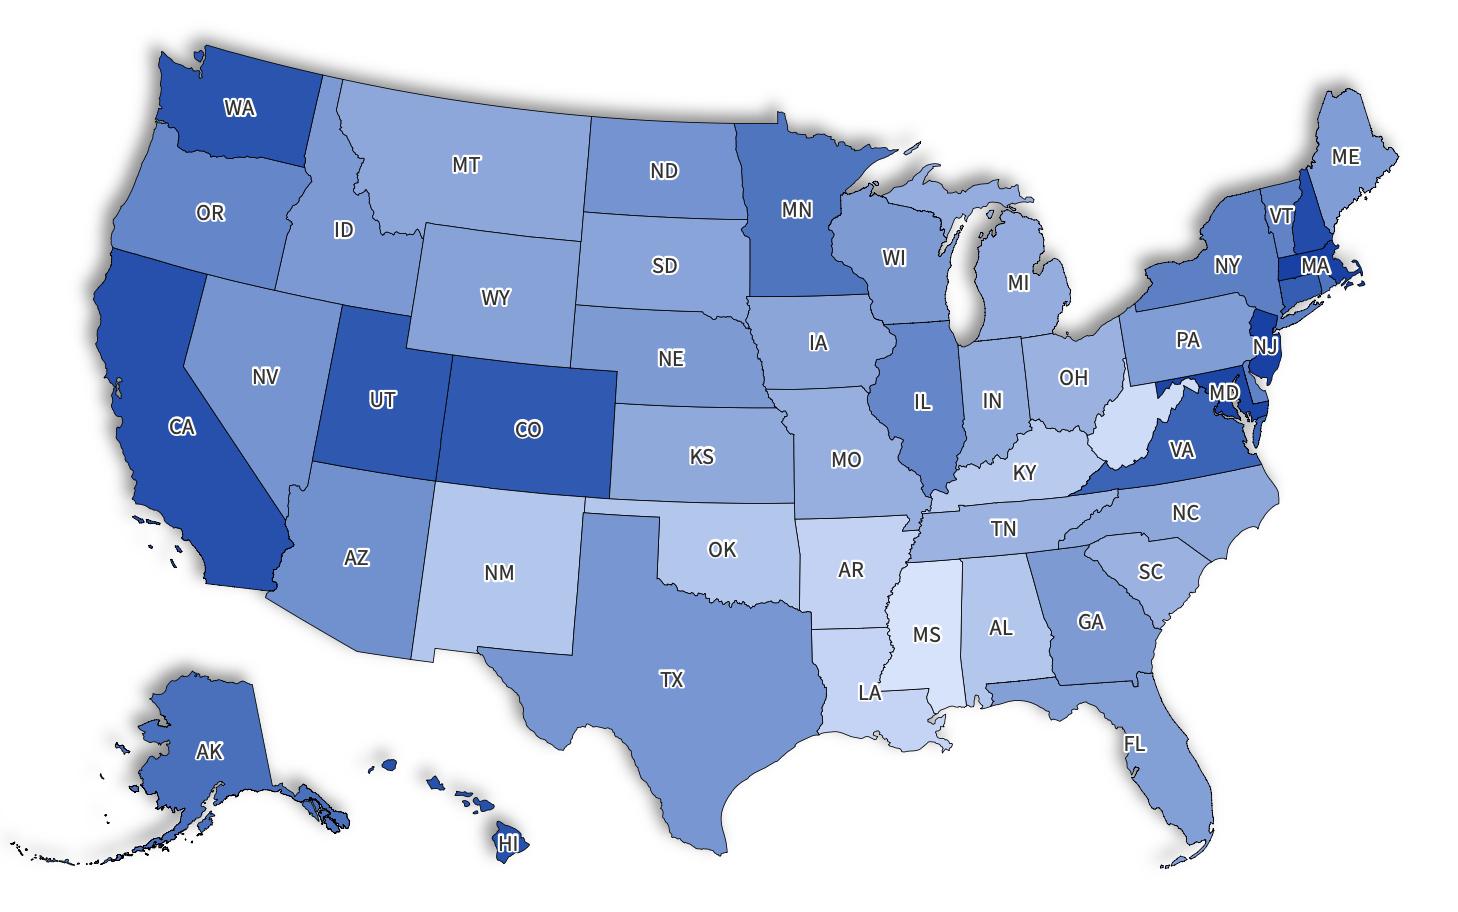
 What Salary Puts You in the Middle Class Across All U.S. States?
A recent research has disclosed the salary required for maintaining a middle-class life across all U.S. states, with the lowest acceptable earnings differing by as much as $30,000. The American mid…